RESEARCH
October 12, 2026
Beyond Payments: the stablecoin banking stack and improving capital efficiency
Where stablecoin rails create value beyond payments: flows, trapped capital and on-chain yield.
Stablecoins moved $33 trillion last year without touching a bank. Only 1% of it paid for goods and services. The rest was value being held, traded, posted as collateral and earning yield: banking, happening outside banks.
That’s the opportunity and the threat. The pools in play are $190 trillion in cross-border flows, $4 trillion of capital trapped prefunding nostro accounts, $6.6 trillion in US deposits that earn nothing and can now move. The on-chain rail is proven. What’s missing is the bank layer around it: licences, liquidity, fiat in and out, custody, compliance.
Adoption isn’t a forecast. APAC moved $2.4 trillion in stablecoins last year. Singapore and Hong Kong rank just behind the US, and more than half of institutions in the region are already live. In Latin America, institutions use stablecoins for cross-border payments more than anywhere else. Banks that engage now can keep the customer. Banks that wait may find the balance sheet has already left.
Banking-style activity is already on chain
Artemis, via Bloomberg, counted $33 trillion of on-chain stablecoin transfers in 2025. Estimates range from about $28 trillion (BIS) to more than $62 trillion (BCG with Allium). Most of that volume is trading, collateral movement and protocol mechanics, and part of it is automated or circular, which is one reason the estimates differ so widely. Gross transfer volume therefore overstates real use, and we do not rely on it as evidence of banking activity. Narrower measures point the same way, if more modestly. Tokenized US Treasury funds held about $14.8 billion on chain on 6 October 2026 (RWA.xyz), and stablecoin supply of $312 billion is itself a dollar balance held outside bank deposit accounts. Decentralized finance and other venues offer faster ways to trade, post collateral, borrow and earn. We have not sized lending or collateral in this paper, so those uses are described and not measured.
Payments are the exception. McKinsey and Artemis estimate real payments for goods and services at about $390 billion in 2025, roughly 1% of raw volume and 0.02% of global payment flows (2025 payments against 2024 global flows). BCG and Allium give a range of $350 billion to $550 billion and describe it as a lower bound. McKinsey and Artemis put B2B payments, the largest segment, at $226 billion, up 733% year on year. Users who trade, borrow and earn on chain still need to move between fiat and stablecoins, hold assets in custody that fits their regulatory status, and pass compliance checks. Those functions sit with regulated providers, not with the protocols, and they are the same functions payments need.
Three pools are open to stablecoin rails
Payment flows are the value that moves. Trapped capital is the cash held to fund those flows. On-chain yield is what balances can earn once they sit in stablecoins. Figure 1 sets the three side by side on one scale, with the revenue earned on flows alongside. Stablecoins carry about 0.2% of cross-border flows and, on a rough comparison, under 5% of the US deposit pool. We have no measure of their share of trapped capital. The opportunity is therefore large, and its size is uncertain.
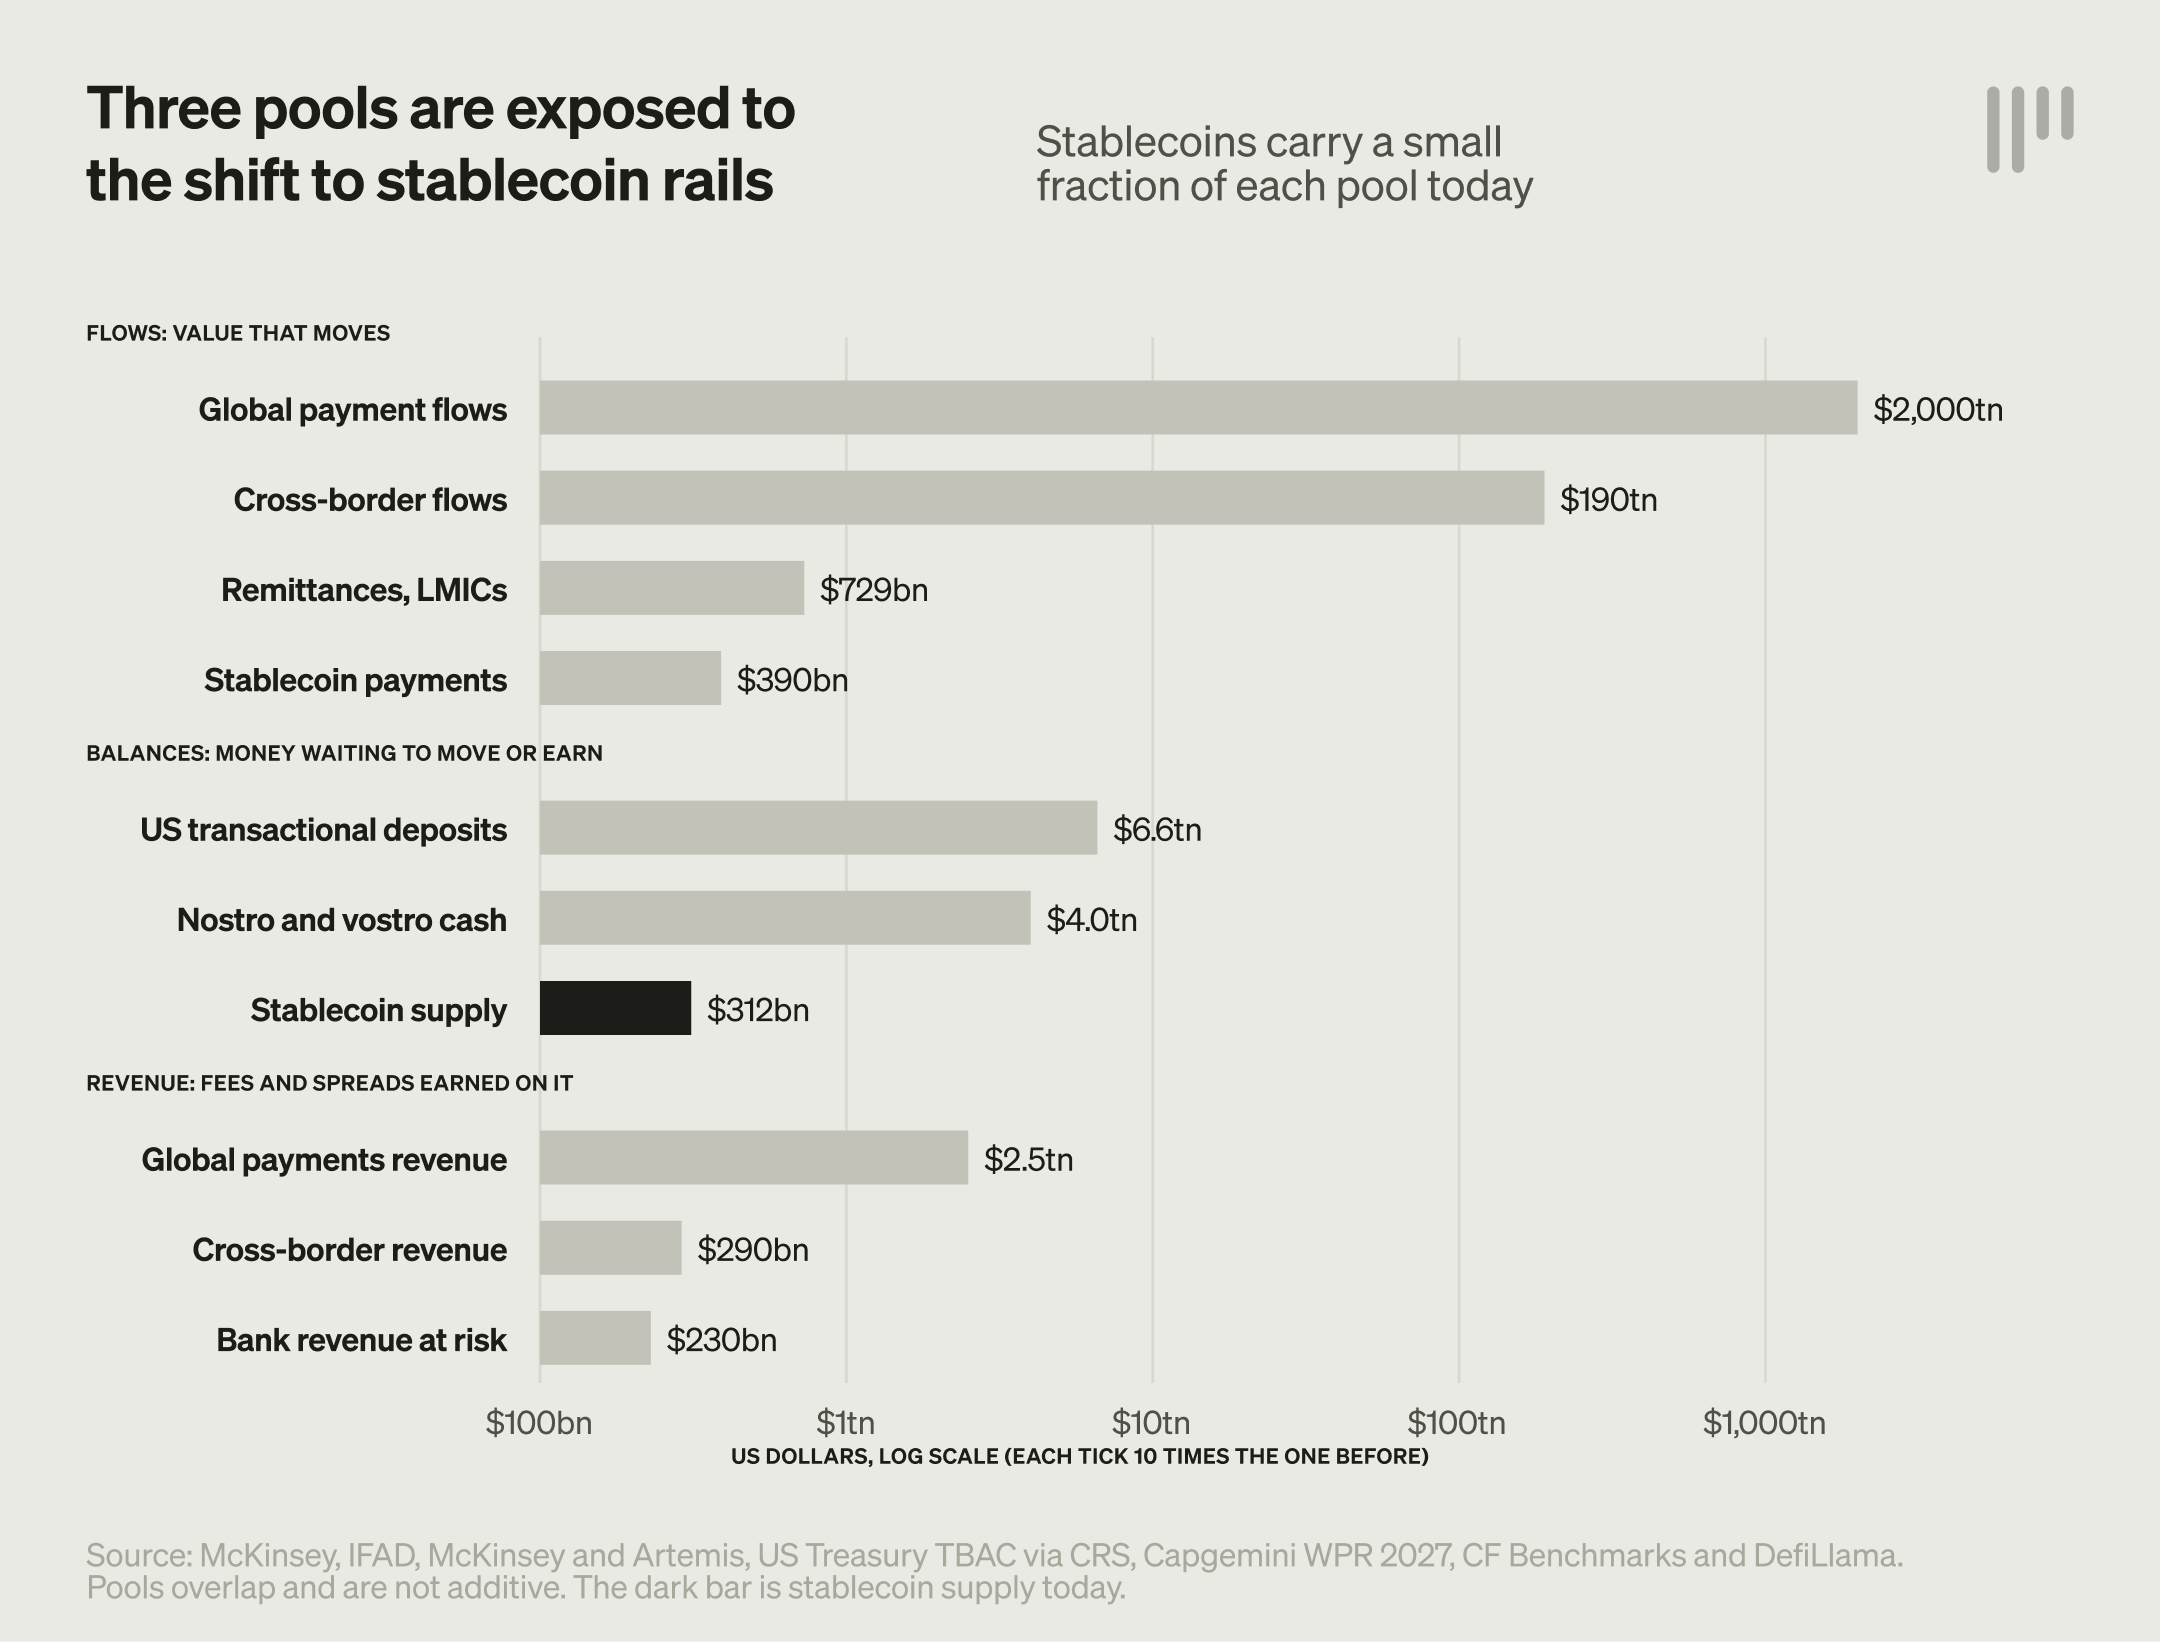
Figure 1. The pools open to stablecoin rails. Pools overlap and are not additive. US deposits are a US-only pool and stablecoin supply is global, so that comparison is rough. View full size
Payment flows
Cross-border payments moved about $190 trillion in 2025 (McKinsey). Real stablecoin payments equal about 0.2% of that value, and even that overstates the share, because some of those payments are domestic. The margin is not where the volume is. McKinsey’s lower-value category covers peer-to-peer (P2P), consumer-to-business, business-to-consumer and lower-value B2B payments. In 2024 these flows were about 10% of cross-border value but earned close to one third of revenue, with margins as high as 3.4% on P2P transfers. Large wholesale flows earn thin margins and are already served by big banks and SWIFT. Remittances to low and middle income countries, a subset of these flows, reached $729 billion in 2025 (IFAD), and global payments revenue is about $2.5 trillion on $2.0 quadrillion of flows (McKinsey), of which cross-border payments are the $290 billion pool below. The first revenue to move is therefore likely to come from consumer, small business and P2P flows, and from the cards that spend them.
Cross-border payments generate a revenue pool of more than $290 billion on about $190 trillion of flows, an average of about 15 basis points (McKinsey, with our calculation). Capgemini estimates that up to $230 billion of bank payments revenue is at risk from stablecoins, tokenized deposits and central bank digital currencies, tied to a share of roughly 4% of global payments volume by 2030. That scope and horizon differ from our scenarios, so the two are not directly comparable. The 2% that Capgemini reports as the cost of a typical B2B payment is also a different measure from the 15 basis point average. The first is a cost per payment, and the second is revenue over all value, which large wholesale payments at thin margins dominate. We have not reconciled the two. In the scenario in Figure 2, stablecoin rails carrying 1%, 5%, 10% or 20% of cross-border flow value at today’s average margin would move about $2.9 billion, $14.5 billion, $29 billion and $58 billion of revenue a year. If lower-value flows move first, the margin on what moves is higher. McKinsey’s shares imply about 51 basis points on lower-value flows against about 11 on the rest, and the same four shares of flow value would move about $9.7 billion, $48 billion, $97 billion and $118 billion. The second case is an upper bound, because it assumes lower-value flows move before anything else. The 10% case equals the whole lower-value pool, since 10% of $190 trillion is $19 trillion. The 20% case adds a further 10% of flows at the 11 basis point average on the rest. McKinsey’s 10% and one-third shares are for 2024 and the pool is for 2025, so both cases are approximate.
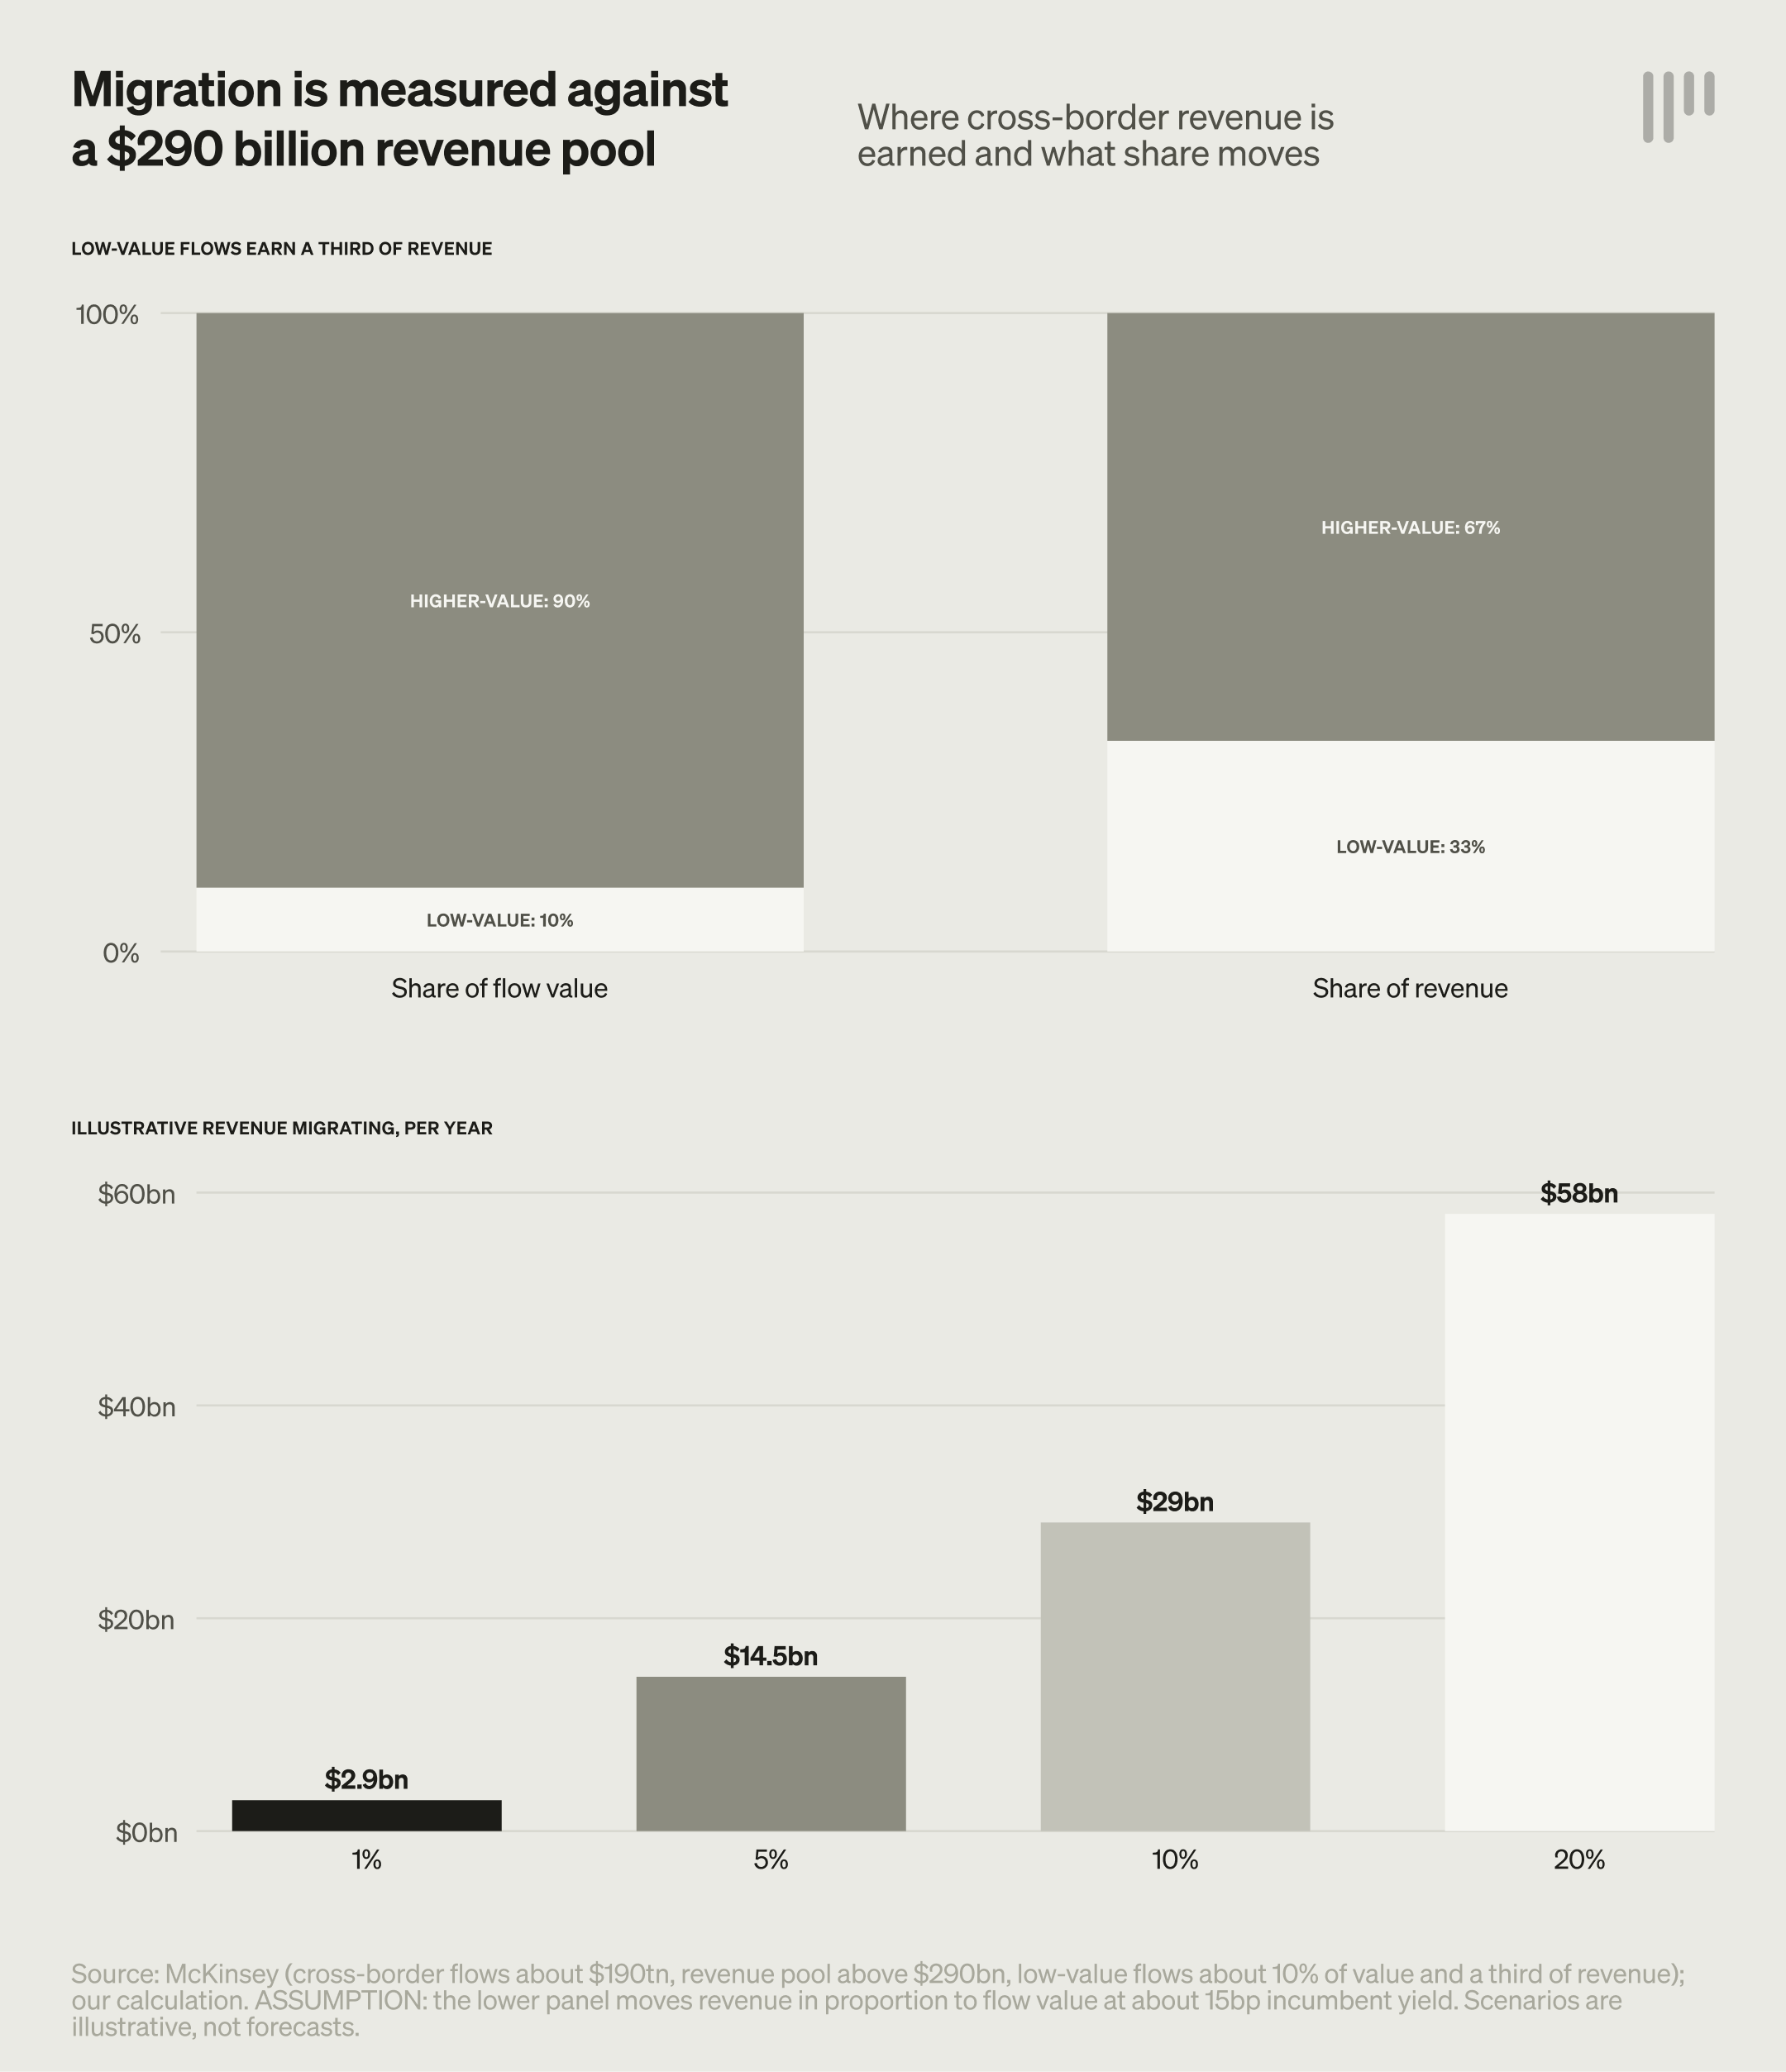
Figure 2. Where cross-border revenue is earned, and illustrative revenue migration under two assumptions. The right panel is an assumption, not a forecast. It ignores price compression, which would shrink the pool as it moves. View full size
Trapped capital
Capgemini estimates that about $4 trillion sits in nostro, vostro and other settlement accounts to fund cross-border flows, although published estimates of its size vary widely. Balances in these accounts may earn some interest, but they earn little relative to their cost and are operationally locked to a correspondent and a currency. Pre-funding is a cost of slow settlement, and the delay sits at the fiat connections, not on the network. SWIFT’s review of 2025 reports that 75% of payments on its network reach the beneficiary bank within 10 minutes, and that about 80% of total transaction time comes after that point, in regulatory checks, manual handling and the absence of 24/7 infrastructure at the receiving end.
The result falls short of policy targets. The Financial Stability Board (FSB) reported in October 2025 that about 55% of wholesale payments were credited within one hour, and that only about 35% of retail payment services advertised one-hour crediting, against a G20 target of 75% by end-2027. The FSB judged the targets unlikely to be met. Capgemini’s World Payments Report 2027 puts the end-to-end time for a corporate cross-border payment at roughly 3.5 days, and the cost of a typical B2B payment at about 2% of its value.
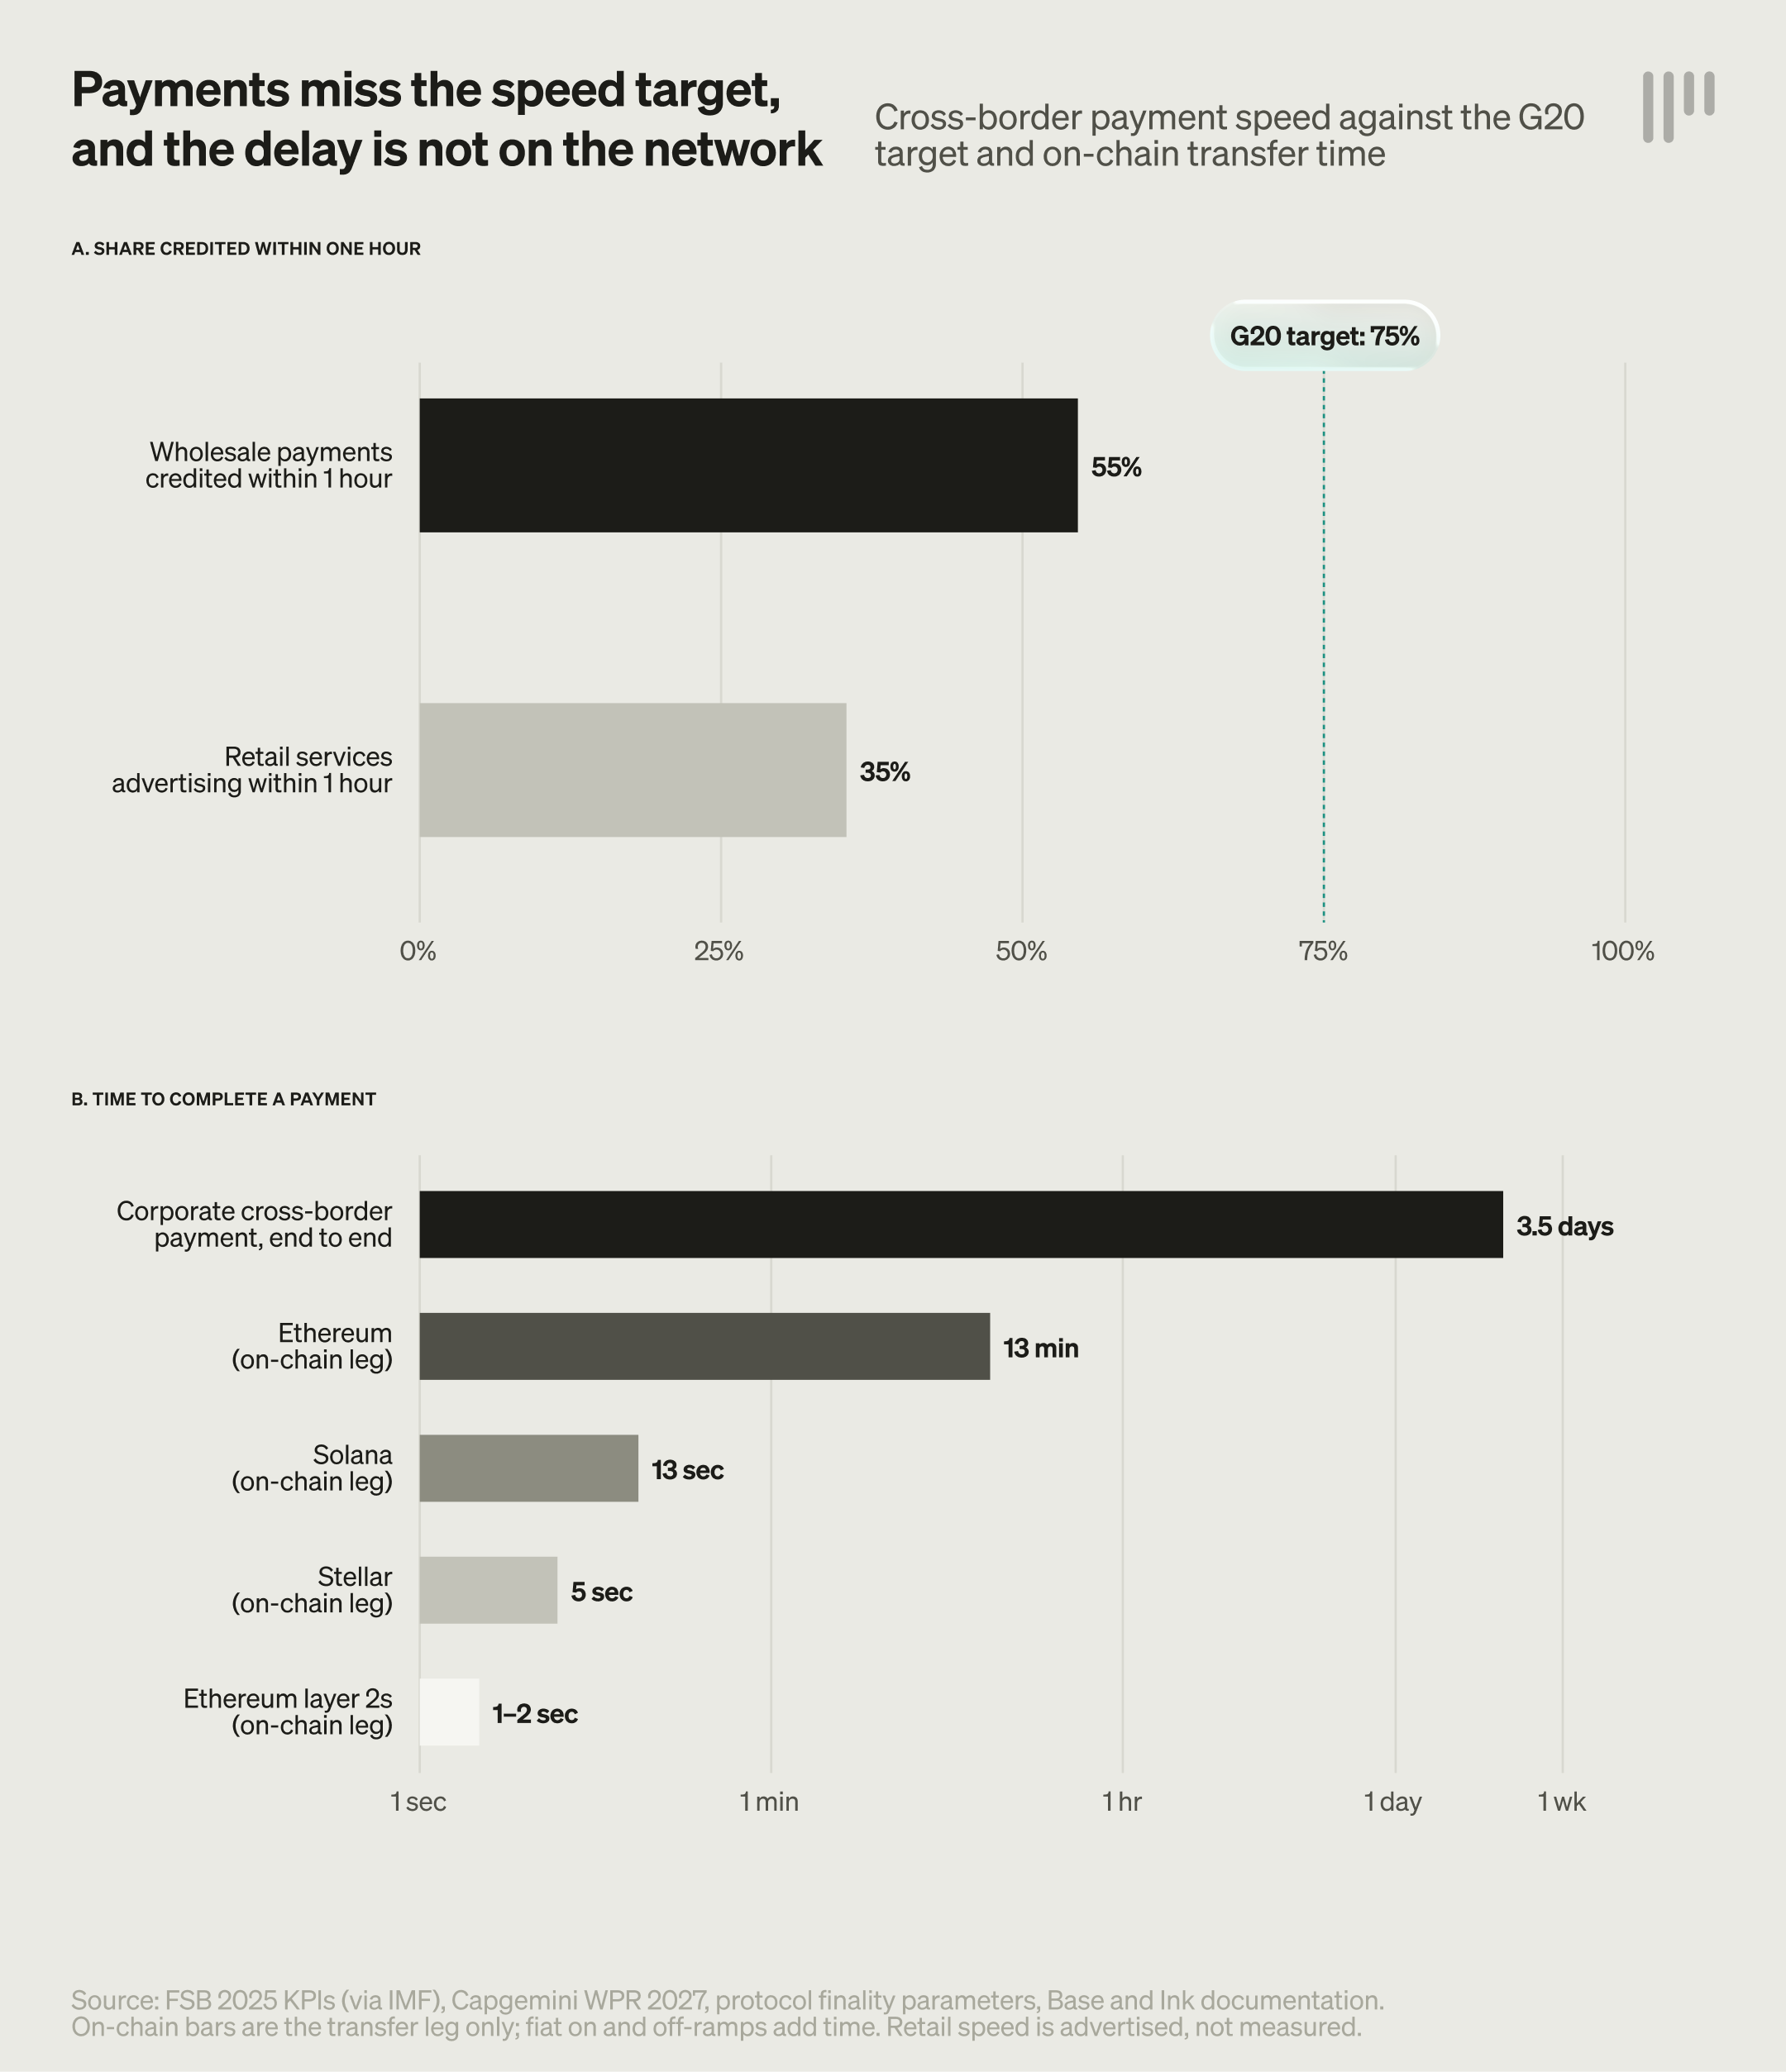
Figure 3. Cross-border payment speed against the G20 target (A) and time to complete a payment (B). On-chain bars show the transfer leg only. The hatched Ethereum layer-2 bar is block time with sequencer pre-confirmation on Base and Ink, not finality. View full size
A stablecoin transfer settles on a shared ledger that runs around the clock, with no correspondent chain and no cut-off time. Block time is one to two seconds on Ethereum layer-2 networks such as Base and Ink, and each network’s sequencer issues pre-confirmations in about 200 milliseconds. Those are not final, and we found no published finality figure for these networks, because finality for a batch follows later on Ethereum. Finality takes about 13 seconds on Solana, about 5 seconds for a Stellar ledger to close and about 13 minutes on Ethereum itself (Figure 3, panel B). Settlement that is final within seconds to minutes on these networks shortens the time funds sit in transit and reduces the float a payer must pre-fund. Large banks can carry that float across many corridors. Smaller banks and small businesses cannot, so they gain most. That conclusion is our analysis.
The constraint moves to the fiat connections. Converting local currency into a stablecoin and back still runs on banking rails, so the slower of the two fiat legs sets the end-to-end time. Domestic instant rails such as Pix, FedNow, SEPA Instant and UPI are already fast and close to free: Brazil’s central bank charges institutions about R$0.001 per Pix transaction. The Bank for International Settlements (BIS) noted in its 2026 Annual Economic Report that stablecoin performance is “uneven once fees, spreads and on-/off-ramp costs are considered.” We found no neutral, all-in cost figure for stablecoin corridors, so we treat cost claims as corridor-specific. The argument is strongest across borders and currencies, where no equivalent public rail exists.
Stablecoin corridors do not remove pre-funding. A provider still needs stablecoin inventory and, more importantly, local-currency liquidity at the off-ramp. Part of the $4 trillion would therefore be relocated to on-ramp and off-ramp providers, not released. How much is released depends on how much faster those providers can recycle liquidity than correspondent banks, and no published estimate measures that. We treat $4 trillion as the size of the pool and not as the amount that can be unlocked.
On-chain yield
A US Treasury advisory committee flagged about $6.6 trillion of US transactional deposits as exposed to stablecoins in 2025. That figure is the size of the pool, not a forecast of outflows. Stablecoin supply of $312 billion is global and under 5% of this US-only pool (our calculation), so the comparison is rough. If balances can earn on chain, we would expect flows to follow them. How much of the pool is contestable depends on whether stablecoin issuers may pay yield, which US rules currently restrict (see “What sets the pace”). Staking and other yield strategies on non-stablecoin assets do not address this pool.
Latin America first, not Africa
Low-value flows earn the most per dollar, so the next question is which corridors they travel and where legacy rails serve them worst. Sending $200 to Sub-Saharan Africa costs 8.46% on average, the highest of any receiving region (World Bank, Figure 4). South Africa is the costliest G20 country to send from, at 15.65%. Cost alone does not predict where stablecoin payments arrive first, however. The average cost of sending to Latin America, 5.64%, is below the 6.36% global average.
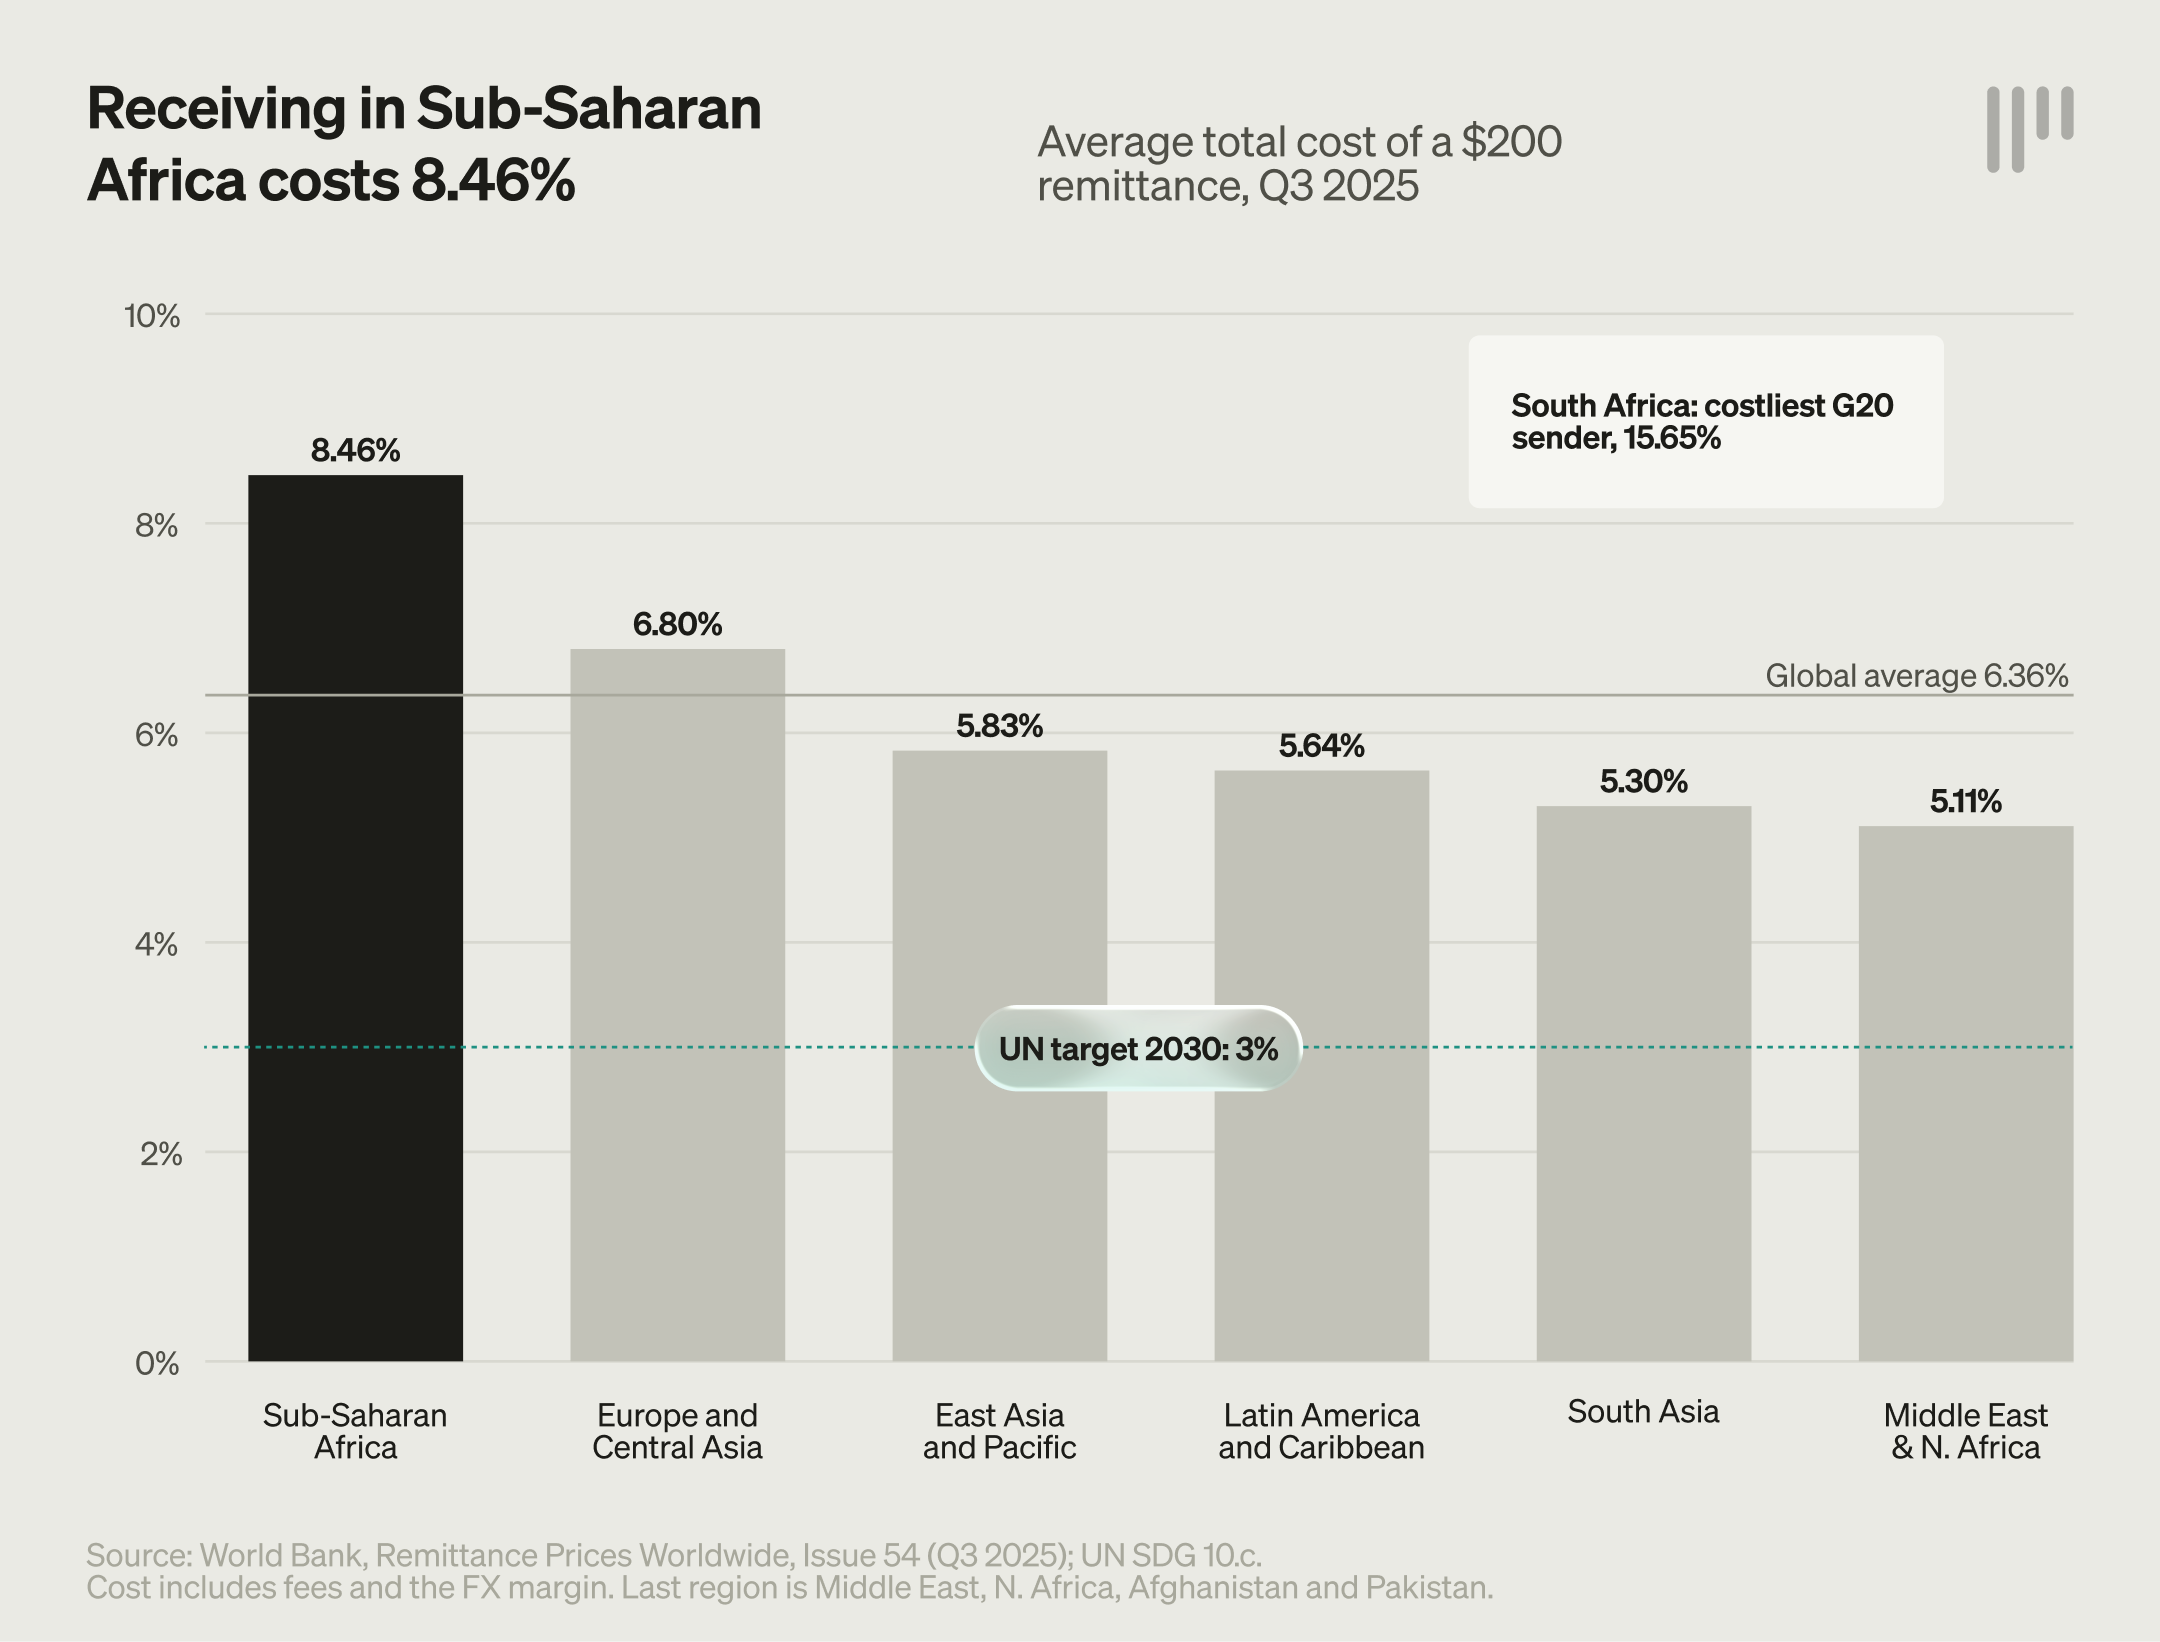
Figure 4. Average cost of sending $200 by receiving region, third quarter 2025, against the global average and the UN target of 3% by 2030. Latin America is highlighted. View full size
Adoption is fastest where three conditions line up: legacy rails that are expensive or slow for the flows that matter, demand for dollars driven by currency stress, and fast local rails to move money in and out of stablecoins. The average above covers consumer remittances. The flows where legacy rails fall short in Latin America are business currency conversion and access to dollars. A Harvard Business School working paper finds bank retail foreign exchange markups of 200 to 400 basis points, against wholesale spreads below 10 basis points for actively traded emerging-market currencies. The paper is not specific to Latin America, so applying it to the region is our inference. Dollar demand follows from currency stress. Latin America meets all three conditions on that basis, with Pix and SPEI providing the local rails. Chainalysis reports that stablecoins were 32.1% of the region’s crypto cross-border value in the year to June 2026, and that Mexico’s monthly cross-border stablecoin flows reached $1.8 billion, four times the early-2024 pace. The regional share includes Argentina and Venezuela, so it overstates payments use. Sub-Saharan Africa has the greater need, but access depends on mobile money and peer-to-peer markets, which are harder to serve at institutional scale. Hubs such as the UAE, Singapore and Hong Kong combine clear licensing with trade routes to South Asia, Southeast Asia and Africa. Adoption should be slower where domestic rails already work, as in the US and the euro area. In Argentina, Nigeria, Turkey and Venezuela, part of the volume is households saving in dollars, which adds volume but not payments revenue.
The opportunity sits outside the incumbent network
The largest banks are already served. They hold correspondent relationships and scale, 17 of them are preparing to pilot Swift’s new ledger, and Swift already serves them. They are not the target. The infrastructure they are building, the Swift ledger and other bank consortia, is for members. The target is the institutions outside the incumbent network: neobanks, small and mid-sized banks, small businesses and merchants. They are underserved by legacy rails, they are exposed to the highest margins on the lower-value flows described above, and many cannot pre-fund multiple corridors or join a bank consortium on the terms the largest banks can. What they need is a provider that already owns the fiat connections: one that can be live in months, not years, keeps the activity off their balance sheet, and reaches markets where they hold no license. This description of the target institutions and their needs is our analysis and reflects Payward Services’ positioning.
The incumbents are not standing still. Table 1 sets out who is on each side.
Table 1. Who is disrupted, and who is disrupting
| Disrupted | Disrupting |
|---|---|
| Correspondent banks Active relationships fell about 30% from 2011 to 2022 (BIS). | Issuers and infrastructure providers The Hong Kong Monetary Authority granted its first stablecoin issuer licenses on 10 April 2026, to HSBC and Anchorpoint. |
| Bank wires and foreign exchange Banks average 14.99% to send $200, the costliest provider type (World Bank). | Incumbent networks and banks Mastercard closed its purchase of BVNK on 3 August 2026 for up to $1.8 billion. A 21-firm dollar consortium is targeting the first half of 2027. The 37-bank Qivalis euro coin has applied for Dutch central bank authorization ahead of a launch planned for later in 2026. Visa stablecoin settlement is above a $20 billion annualized run rate (Visa, September 2026). |
| Remittance operators International money transfer operators average 5.52%, still above the UN target of 3% by 2030 (World Bank). | Corporates moving volume Non-banks already carry 36% of B2B payment volume, and nearly 60% of corporates would use non-bank stablecoin providers (Capgemini). |
On 9 July 2026, Swift said its blockchain-based ledger was ready for initial use, with 17 banks, including Citi, HSBC and BNP Paribas, preparing to pilot live 24/7 cross-border payments in tokenized deposits. Swift is also implementing a retail payments framework with upfront fee transparency and full value delivery. These moves close part of the speed gap inside the banking system, so stablecoins will compete with upgraded bank rails, not only legacy ones.
Serving the pools takes a full banking stack
Payments are where the proposition starts, not where it ends. A provider that wants the flows, the trapped capital and the yield needs the layers a bank supplies: on-ramps and off-ramps, wallets and accounts, yield, conversions, payments, cards and liquidity, all resting on a licensing and compliance foundation (Figure 5). The client keeps ownership of its product, its customer relationship and the customer experience.
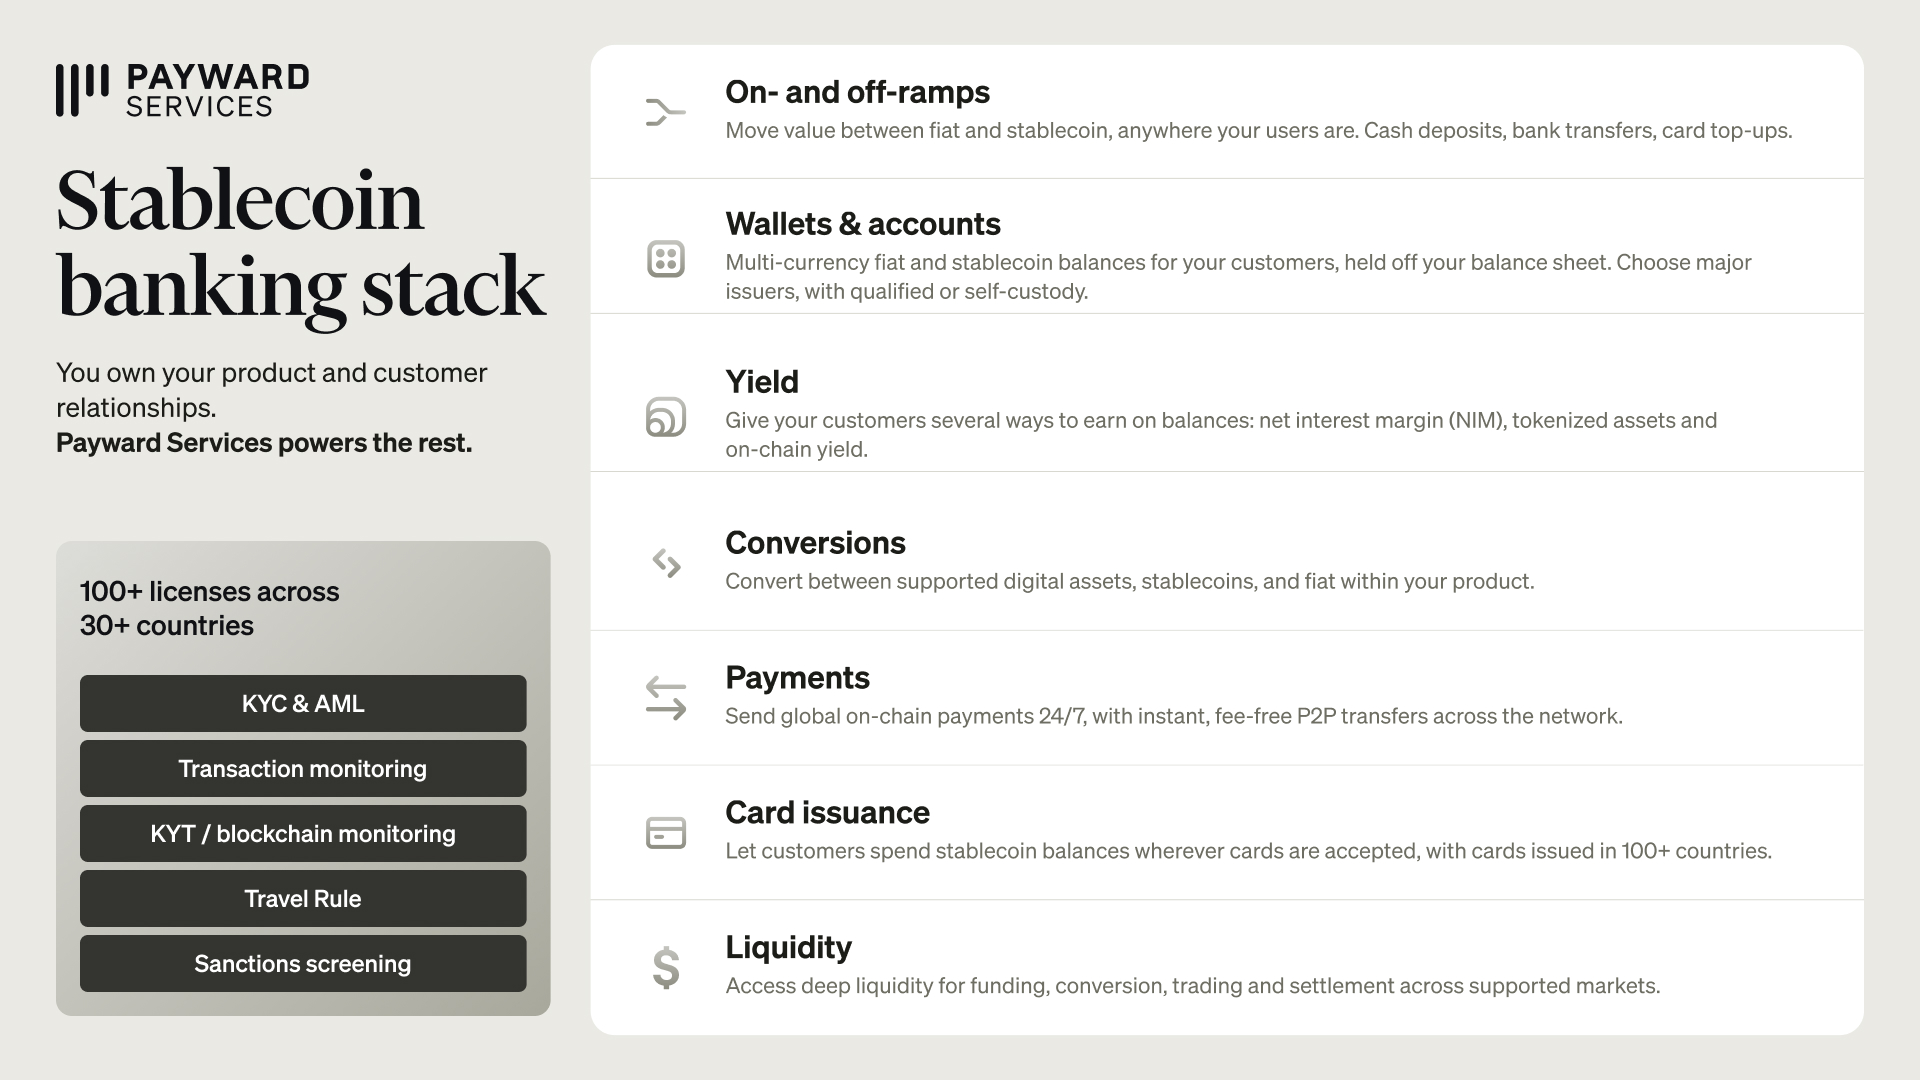
Figure 5. Payward Services stablecoin banking stack. View full size
Three layers decide the economics. Liquidity sets the price of every conversion at the fiat leg, which is where this paper finds time, cost and compliance work accumulate. Licensing and compliance decide where a provider may operate: customer onboarding and know-your-customer (KYC) checks, anti-money laundering (AML) controls, transaction monitoring, blockchain monitoring (known as know-your-transaction, or KYT), Travel Rule compliance and sanctions screening. Payward Services reports more than 100 licenses across more than 30 countries. A provider without its own liquidity and licenses buys them from others, which adds cost, delay and counterparties. Wallets and accounts set who can hold the assets: self-custody, qualified custody and traditional custody serve different customers and regulators. Cards, which Payward Services reports as available in more than 100 countries depending on program and market, extend the reach beyond transfers into everyday spending. Payward Services reports that eligible transfers between clients inside the same network are instant and carry no fee. Yield in Figure 5 means staking and yield strategies on supported digital assets where permitted. It does not address the US deposit pool in Figure 1, and yield on stablecoin balances depends on issuer rules and jurisdiction.
What sets the pace
Rules, supply and risk decide how fast this arrives. In the US, the GENIUS Act takes effect on 18 January 2027, or 120 days after final rules if that is earlier, and the proposed rules from the Office of the Comptroller of the Currency (OCC) are not yet final. The Comptroller said in August that final rules would come by November. The Act bars issuers from paying yield to holders, and the OCC proposal would presume that certain affiliate and third-party yield programs breach that bar. That presumption largely determines how much of the $6.6 trillion deposit pool is contestable. In the EU, the transitional period for service providers under the Markets in Crypto-Assets Regulation (MiCA) ended on 1 July 2026. The Hong Kong Monetary Authority granted its first issuer licenses on 10 April 2026, to HSBC and Anchorpoint, a joint venture of Standard Chartered, HKT and Animoca Brands. In the UK, the Bank of England dropped its proposed holding limits in June 2026 in favor of a temporary issuance cap of £40 billion per systemic stablecoin, with final rules planned by the end of 2026.
Timing is the main uncertainty. On the CF Benchmarks supply series, built from DefiLlama data, supply has drifted lower since its peak of $322.4 billion on 17 May 2026 and stood at $312 billion on 23 September, about 3% below that peak. Supply rose about 50% in 2025, from $205 billion to $307 billion, but only 1.6% in 2026 to date, even as the number of USDT and USDC holders rose to 267 million in the third quarter (Token Terminal).
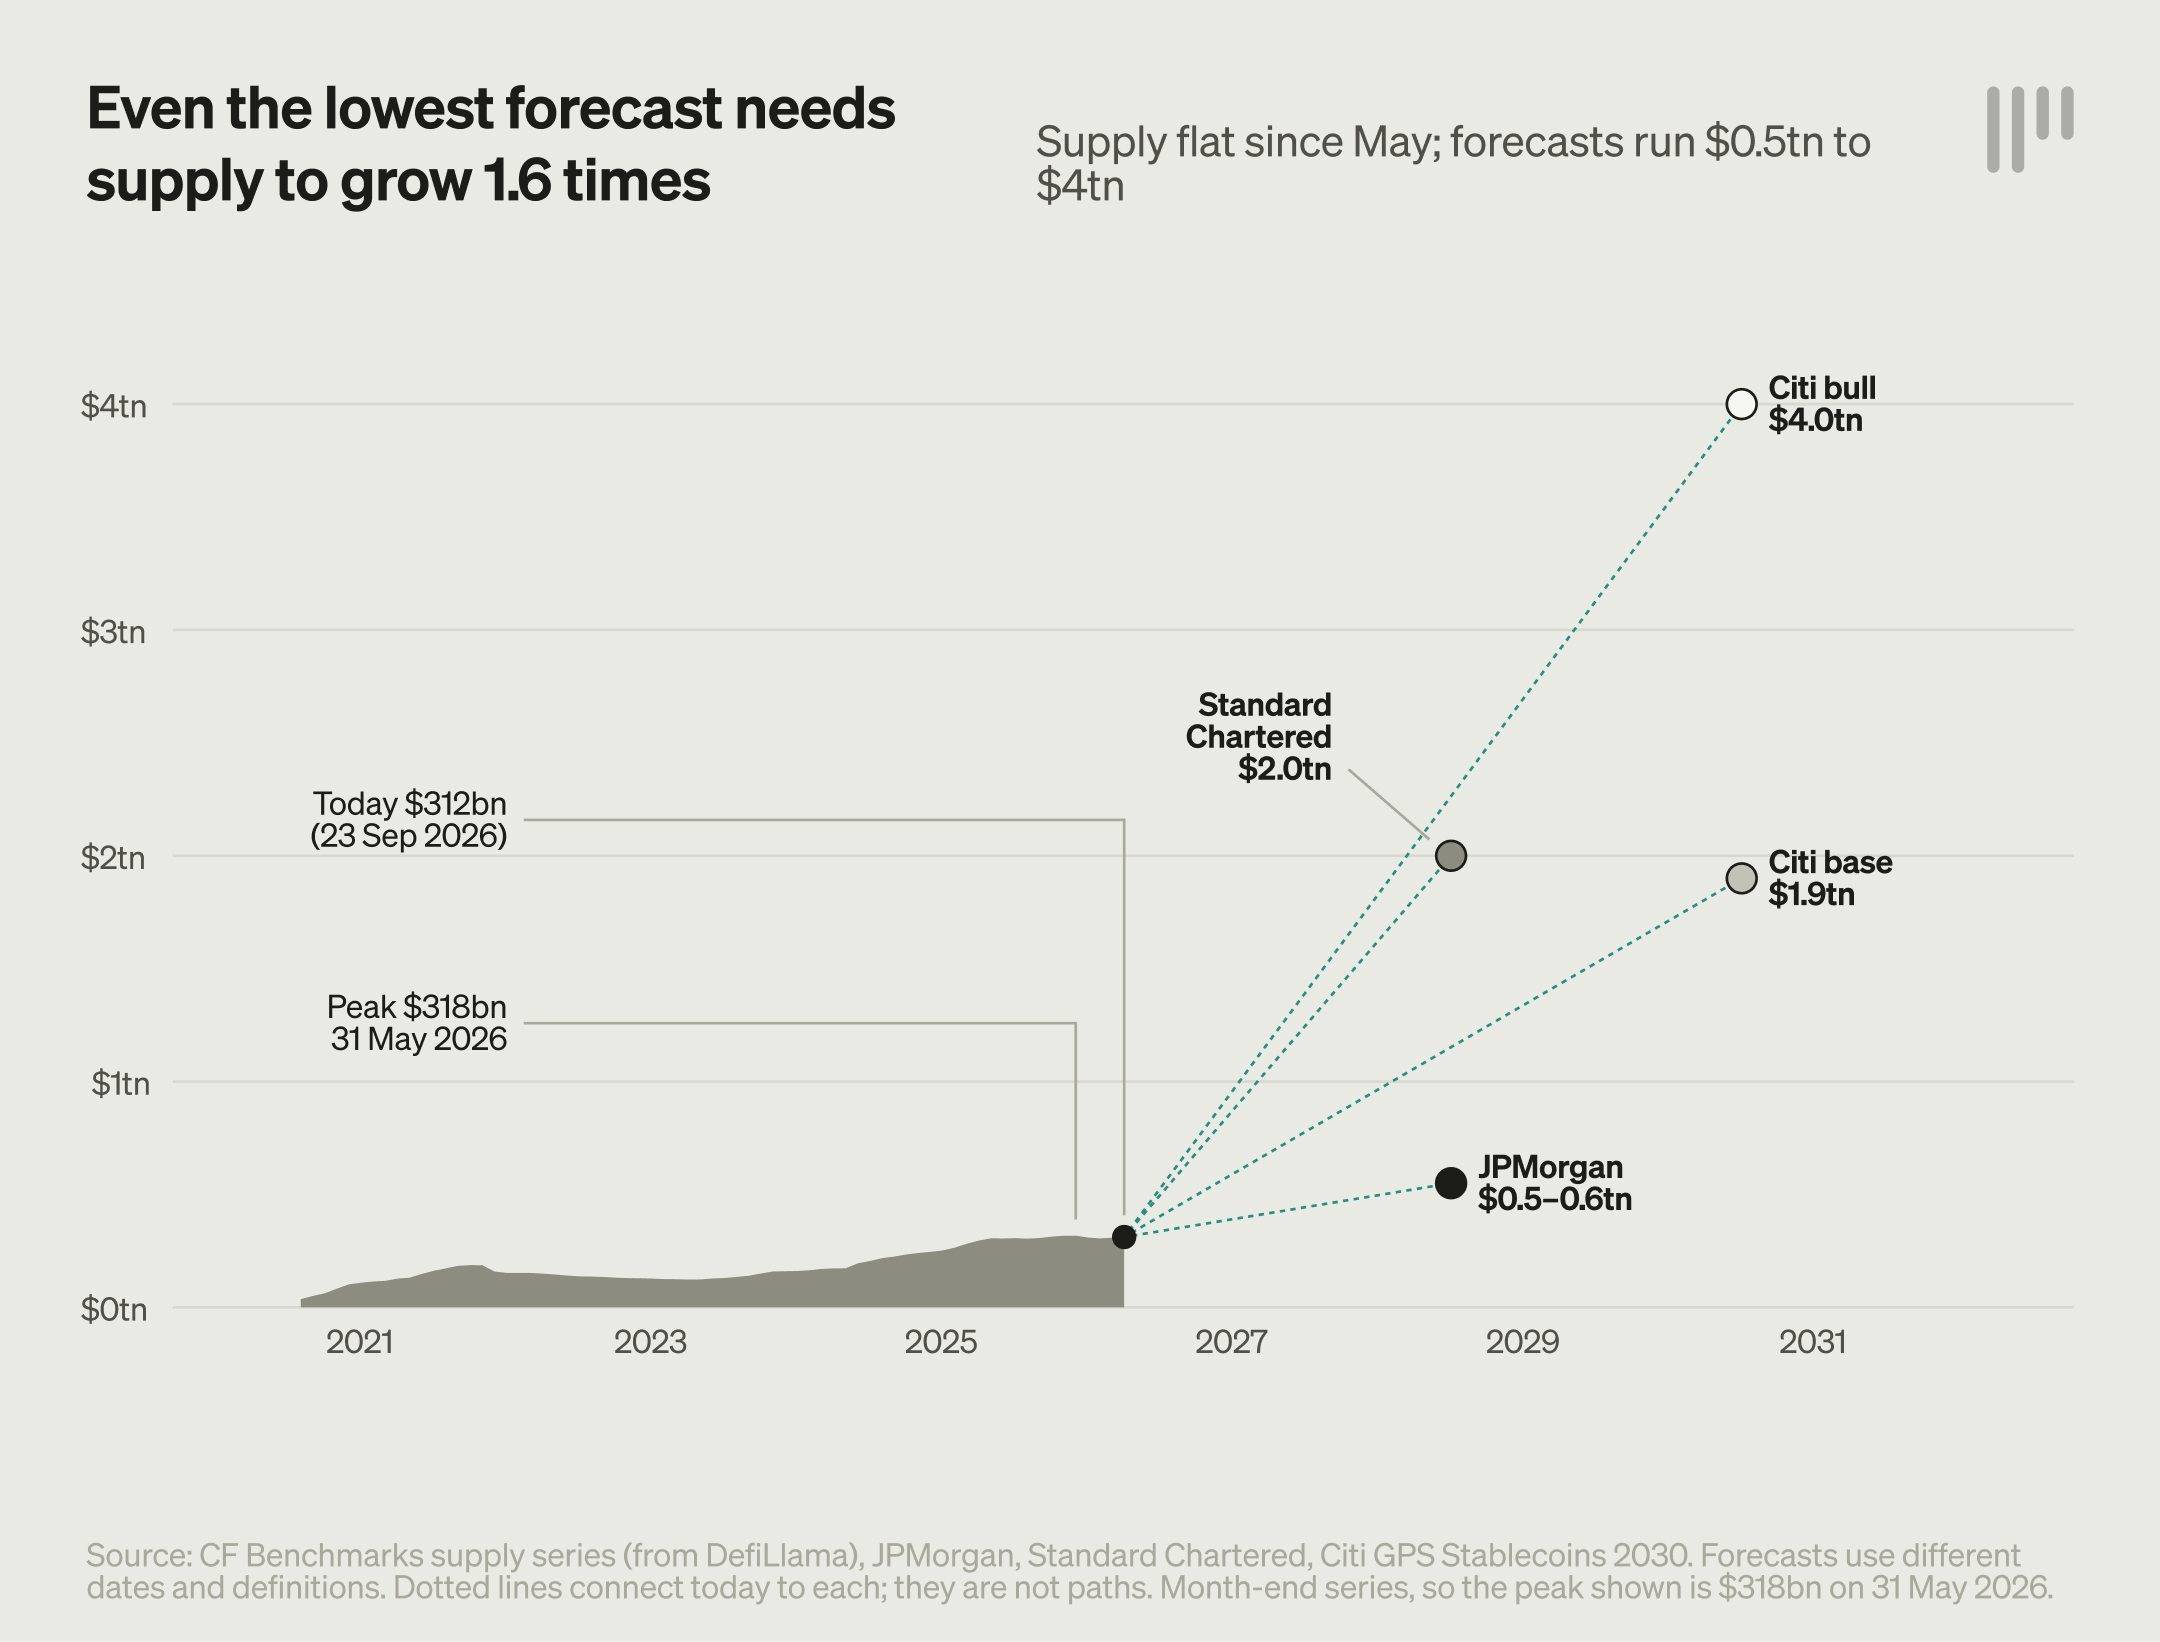
Figure 6. Stablecoin supply and published forecasts. Forecasts differ in date and definition. View full size
Published forecasts (Figure 6) run from $0.5 trillion to $0.6 trillion for 2028 (JPMorgan) to $2.0 trillion for 2028 (Standard Chartered), and from $1.9 trillion to $4.0 trillion for 2030 (Citi base and bull cases). Even the lowest we cite requires supply to grow about 1.6 times from here, and Citi’s base case requires about 6 times.
Adoption could also slow because stablecoins move work rather than remove it. Sanctions screening and Travel Rule checks shift to the on-ramps and off-ramps, so the checks behind most of the delay Swift measures do not disappear. Nearly all supply is dollar-denominated (DefiLlama), so conversion into other currencies still happens at the off-ramp. Tether and Circle together issue more than 80% of supply (DefiLlama), and a depeg or issuer failure would reach every rail built on them.
What it means
Four findings follow for banks, fintechs and platforms weighing a stablecoin strategy. The opportunity spans three pools, not payments alone. Margins are highest on lower-value flows and among institutions outside the incumbent network, where legacy service is weakest. The relevant comparison is upgraded bank rails and tokenized deposits, not legacy correspondent chains. The fiat on-ramp and off-ramp, and the full stack behind it, matter as much as the chain. The window that matters appears to be 2026 to 2027, when US rules take effect and bank ledgers move from pilot to scale.
Payward Services (PWS), the business-to-business infrastructure platform of Kraken’s parent company Payward, gives banks, fintechs and platforms infrastructure to build around these flows, including fiat funding and conversion, stablecoin settlement, custody, embedded wallets, and card issuance and payments through one API.
Customers can hold, trade and pay on one stack, and earn yield on supported digital assets where permitted. The benefits still depend on the corridor. If funding or payout relies on slower local rails, those steps can limit the advantage of faster on-chain settlement. A useful test of fit is the full payment journey, from funding to payout: where stablecoin infrastructure addresses a specific gap, and where slower local rails limit it. To discuss your specific use case, please get in touch with our team.
This material summarizes publicly available third-party information. Kraken does not control, endorse, or guarantee the accuracy or completeness of that information or any linked sites. Payward Services Research is not investment advice; trading digital assets involves significant risk. Content may be restricted or unavailable in some jurisdictions. Kraken and its affiliates may hold positions in digital assets referenced.
Although the term "stablecoin" is commonly used, there is no guarantee that the asset will maintain a stable value in relation to the value of the reference asset when traded on secondary markets or that the reserve of assets, if there is one, will be adequate to satisfy all redemptions.
Research powered by CF Benchmarks, a Payward company
Gabriel Selby, CFA
Head of Research
Mark Pilipczuk
Research Analyst
Sources
Bank for International Settlements, Annual Economic Report 2026.
Bank for International Settlements, correspondent banking data chartpack, May 2023.
Bank of England, policy statement on sterling-denominated systemic stablecoins, June 2026.
Base, Flashblocks documentation (2-second blocks, 200-millisecond pre-confirmations).
BCG and Allium, Stablecoin Payments: The Truth Behind the Numbers, January 2026.
The Block, JPMorgan stablecoin market projections (about $500 billion by 2028), July 2025.
The Block, Standard Chartered stablecoin supply forecast of $2 trillion by 2028.
Bloomberg, Stablecoin transactions rose to record $33 trillion (Artemis data), 8 January 2026.
Capgemini, World Payments Report 2027 press release, 24 September 2026.
CF Benchmarks supply series (built from DefiLlama data), with Token Terminal holder counts (USDT and USDC holders, Q3 2026 average of 267 million), Q3 2026 Outlook secular themes data and daily supply series, as of 21 to 23 September 2026. Internal series with no public URL.
Citi GPS, Stablecoins 2030 (base case $1.9 trillion, bull case $4.0 trillion).
CoinDesk, Citi, Goldman and other global banks team up on stablecoin venture, 1 September 2026.
CoinDesk, JPMorgan says stablecoin market could grow to $600 billion by 2028, 19 December 2025.
US Congress, GENIUS Act (S. 1582), signed 18 July 2025 (effective date, yield prohibition).
The Defiant, 21 financial institutions commit to joint stablecoin venture, 1 September 2026.
Du, Huang and Scharfstein, Harvard Business School working paper, February 2026.
ESMA, Public statement on the end of the MiCA transitional period, June 2026.
Helius, Solana commitment levels (finality of about 12.8 seconds).
Hong Kong Monetary Authority, Granting of stablecoin issuer licenses, 10 April 2026.
International Monetary Fund, cross-border payments session slides (FSB KPI figures), November 2025.
Mastercard, Mastercard completes acquisition of BVNK, August 2026.
McKinsey and Artemis, Stablecoins find their niche, February 2026.
McKinsey, Global Payments Report 2025 ($2.5 trillion of revenue on $2.0 quadrillion of flows).
MigaLabs, Ethereum finality (two epochs, about 12.8 minutes).
Qivalis, press release, 20 May 2026 (25 banks join, bringing the consortium to 37).
- RWA.xyz, Tokenized U.S. Treasury Funds, as of 6 October 2026 ($14.82 billion distributed value).
- Stellar Development Foundation, Ledgers (ledger close in about 5 seconds).
- United Nations, Sustainable Development Goal 10, target 10.c (reduce remittance costs to less than 3% by 2030).
- Visa, Financing the next hundred stablecoin-linked card programs, 8 September 2026 (stablecoin settlement above a $20 billion annualized run rate).
- World Bank, Remittance Prices Worldwide, Issue 54 (third quarter 2025; global, provider and regional costs, Figure 4).